9 Sept. New Moon 18:01. Changeable some thunder possible.
AUTUMN [10th September – 19th November]:
First week (10th September onwards) driest of year on average, especially central & eastern areas … but some years show tendency to a mid-September cyclonic / wet spell … localised heavy (thundery) rainfall resulting from slow-moving areas of low pressure … early / mid October can be ‘two-faced’: often ‘unsettled’ with rain/showers, but occasionally can give rise to anticyclonic / warm conditions, with southerly [S] weather types lifting temperatures to ‘near-record’ levels … between 23rd October & 11th November, strong signal for wet/stormy weather with a sharp reduction in A-type weather; sharp reduction this type last week of October c.f. first week.
http://weatherfaqs.org.uk/node/179: Singularities affecting the British Isles (after HH Lamb)
6.5M. 65km NW of Kirakira, Solomon Islands 2018-09-09 19:31 (UTC).
Between the largest earthquake in a spell and the next largest in that spell there will be a series of volcanic eruptions that can be attributed to said spell by the relationship of the period between such ‘quakes. This can be attributed to the relationship of wind speeds and working conditions on a Frigate in the days of sail called the Beaufort Scale.
If the period between large quakes extends past 30 hours the wind speeds (or number of) tropical storms can be taken as indicative of the eruption(s.) Anything much less than 30 hours can be equated to the developments of said storms.
In a similar manner, the number of volcanic eruptions during a phase of the moon will have a factor relating their numbers to their magnitudes. The larger eruptions tend to cause quiescence in lesser eruptions. Conversely, the more numerous the series, the less overall output will be.
A frigate was the runabout “utility vessel” of the RN. More of them were produced than the war waggons or 64 pounders. Not considered “Ships of The Line”, they were lightly armed and contained smaller crews. Their lengths would vary and consequently the amount of ballast but the rule of thumb was based on them because all hands will have experienced them.
In the same way that synergies multiply the magnitudes of a phenomenon, so the decrease in other related factors tends to lend energy to a phenomenon. Thus as storms decrease earthquakes increase. It is interesting that volcanic eruptions tend to be fewer with the increase of earthquake magnitudes but not with tropical storms.
Why might that be?
Something akin to a cross between the games “Battleship and “Criss Cross Quiz” (a British, 1960’s game-show based on Noughts and Crosses) will indicate the likelihood of large magnitude earthquakes or multiple swarms of them -or large magnitude volcanic eruptions or multiple eruptions.
I first noticed the phenomenon in the NAEFS chart. But this all went to hell in an hand-basket, once Canada started spoiling their data to disguise what was going on with the Hutchison Effect, the opponents of the US President Trump were enacting in meteorology from early in the Clinton Administration:
9 Sep 2018: Dukono, Reventador
It also appears in the application from NullSchool:
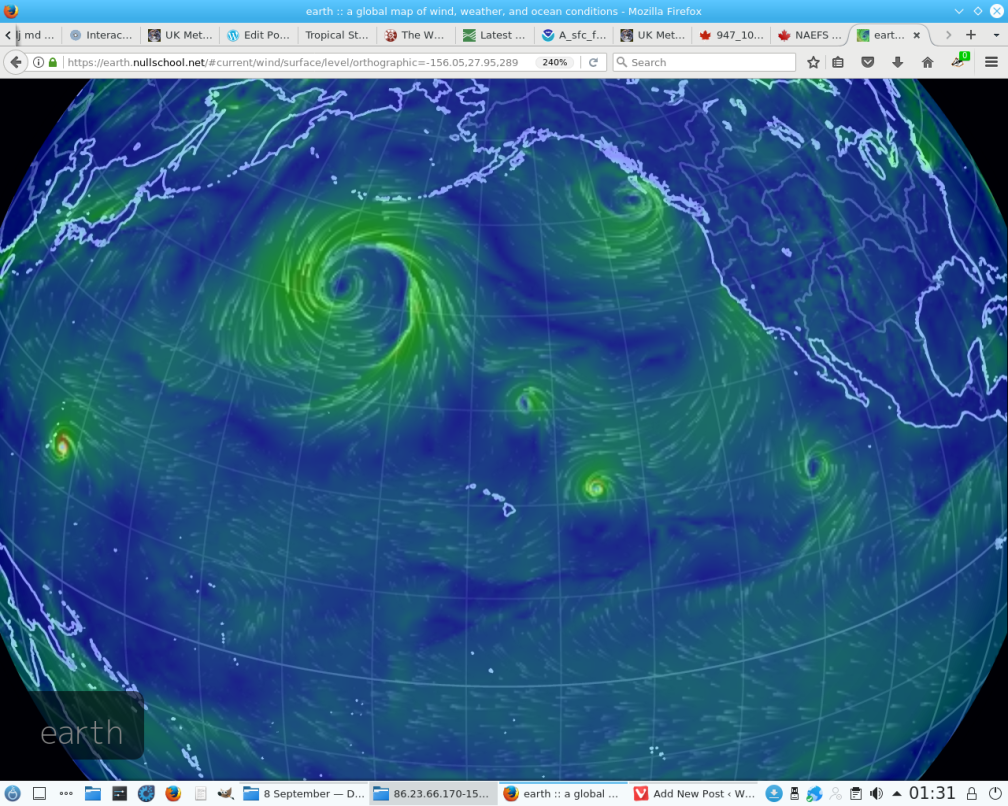
As they do in the centre of this chart. There is also another set up of three in line here:
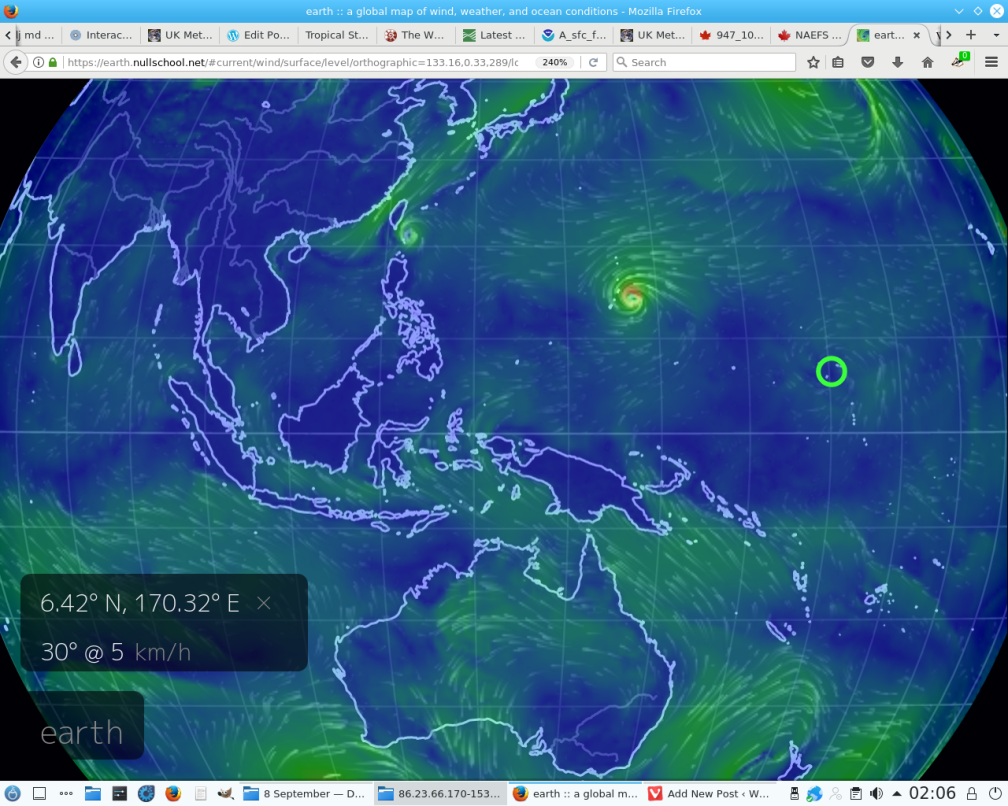
Although this is not fully developed at the moment:
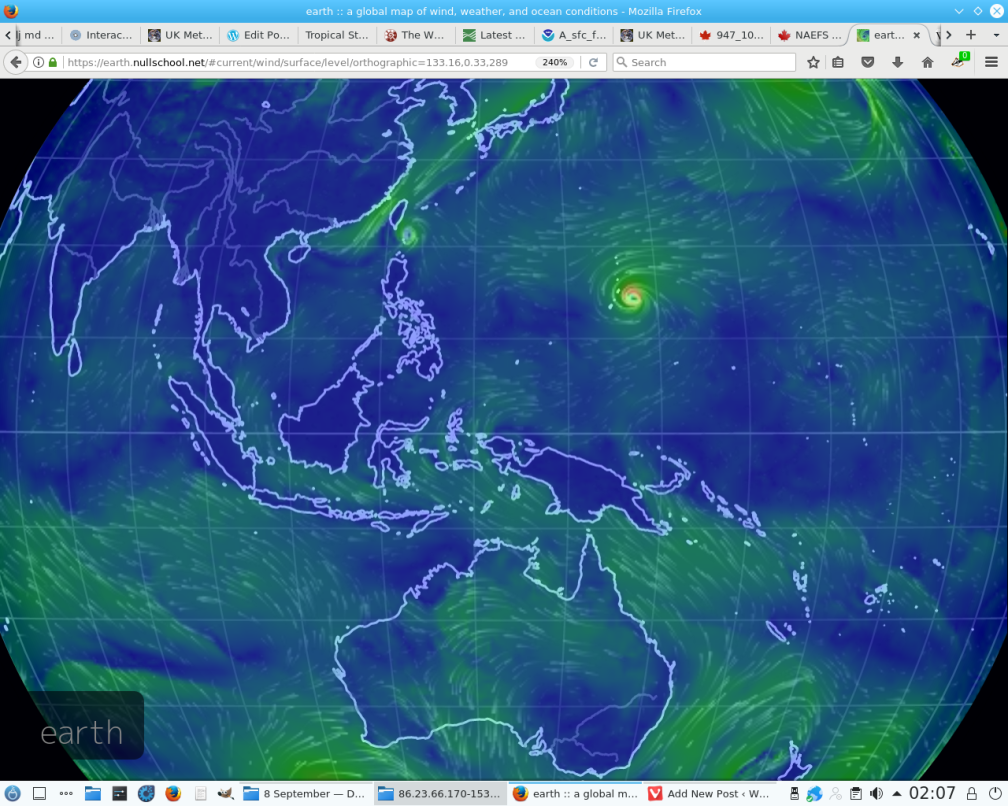
When the cyclones (or anticyclones) are out of line the multiple tends to produce storms, that may be tornadoes or linestorms (shelf cloud/derechos). I have no idea what these in mid-ocean are likely to produce.
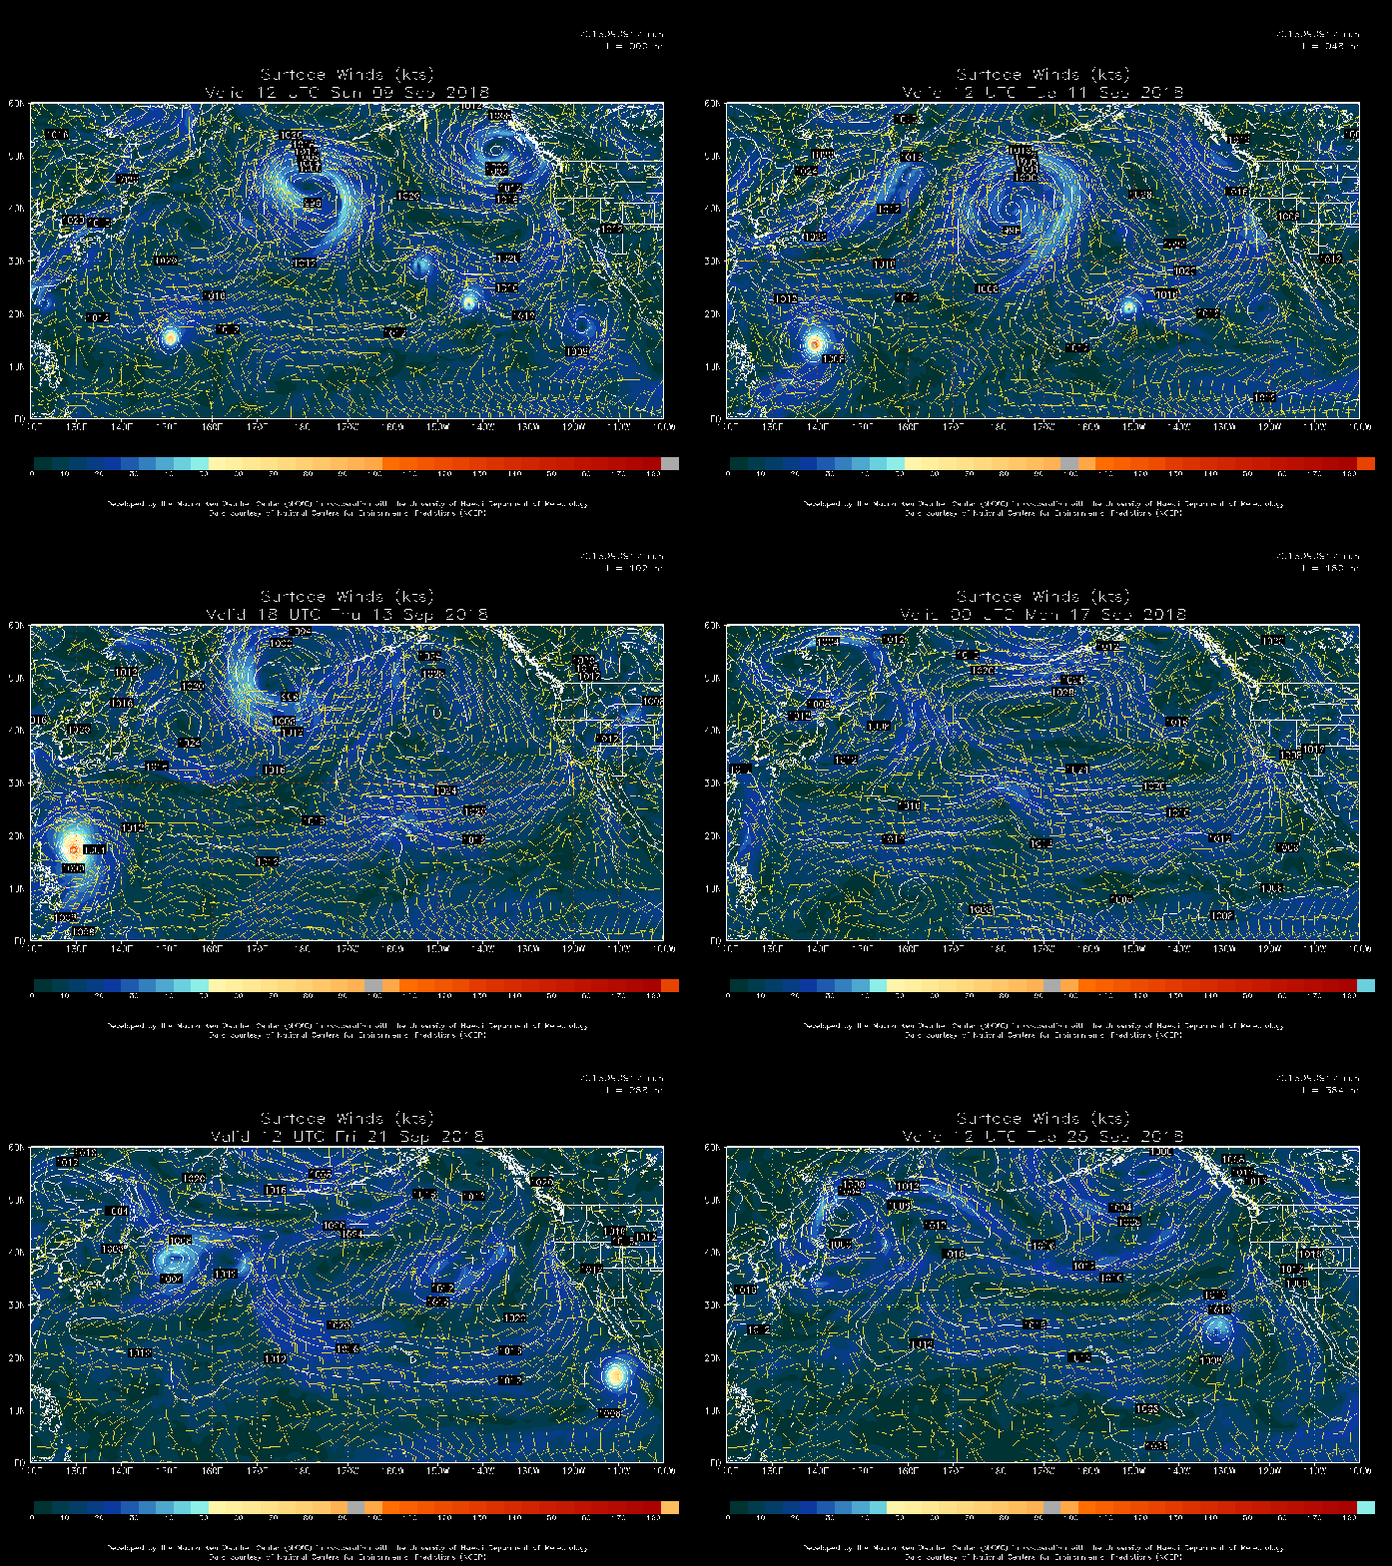
The footprint seems reversed in the NAEFS:
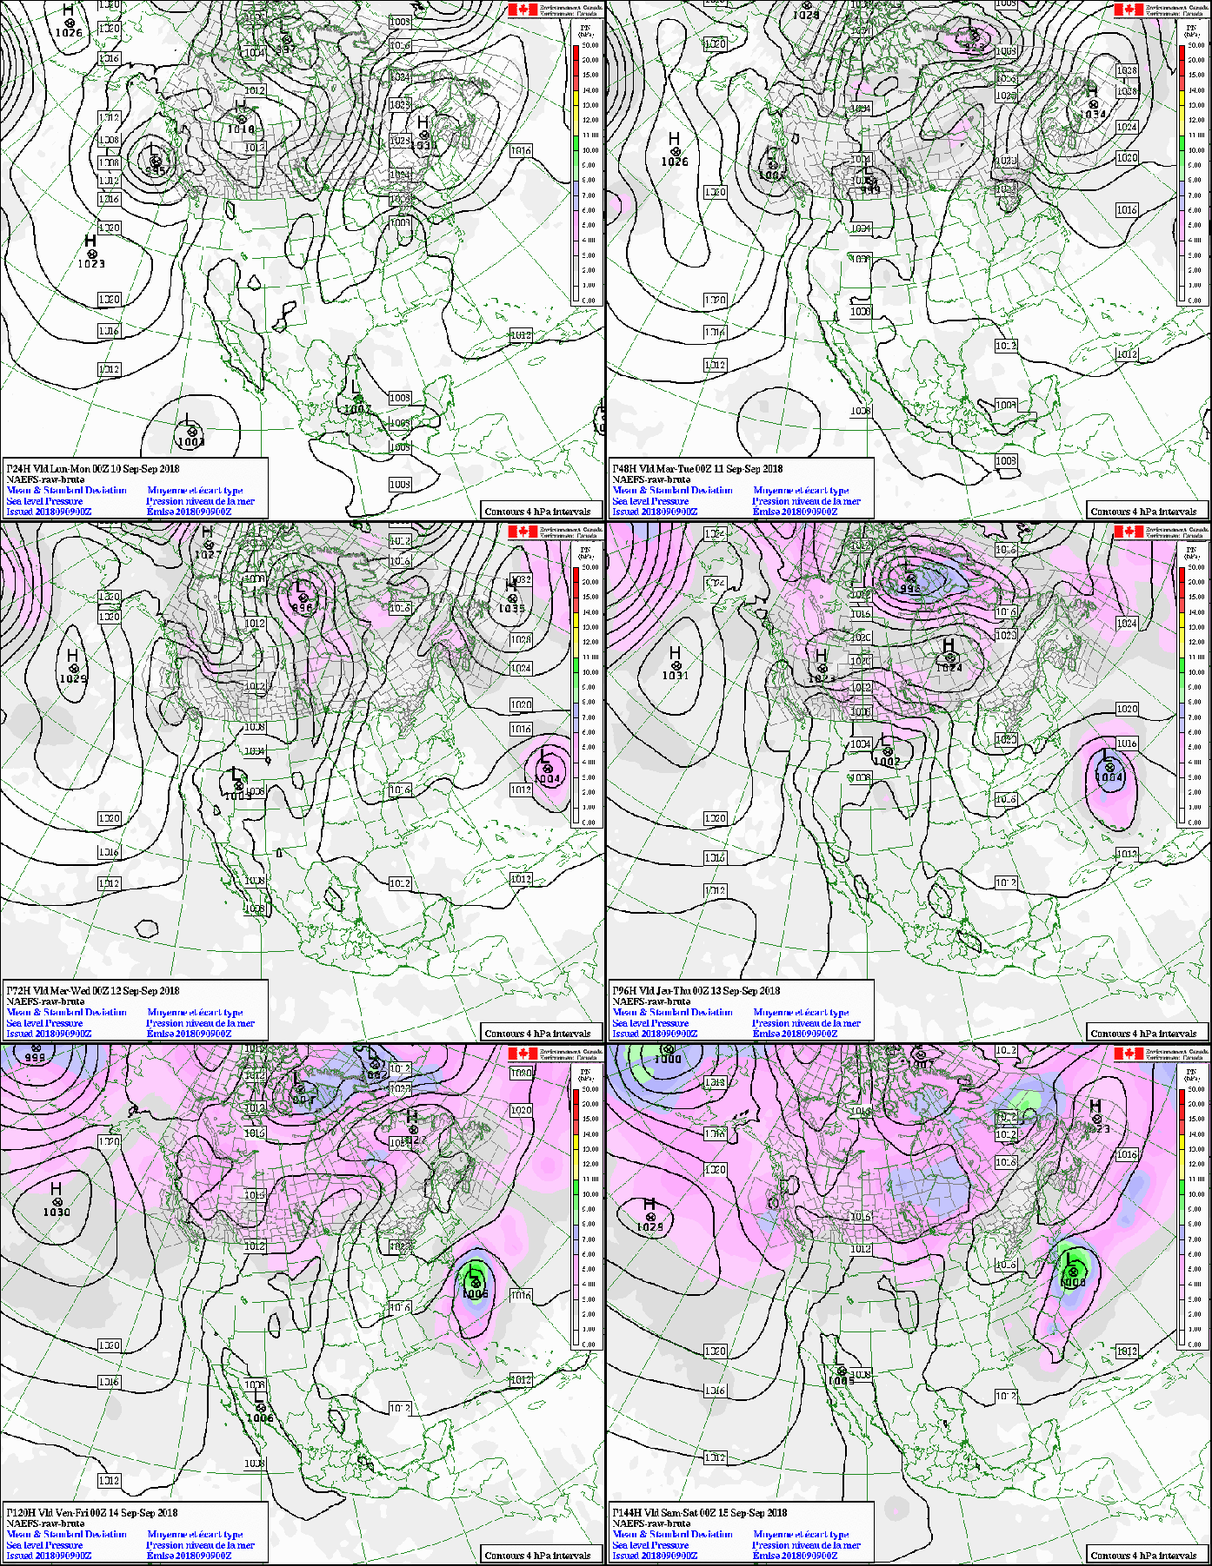
Or is it?
You can open the charts separately if you save the animation and change the format from .gif to any other image graphic protocol. Or at least, this is what happens with Linux systems.
Yes I know how difficult this sort of thing must be for someone who has been taught earth science. It is the truth though at least as far as truth can be proven in a discipline that allow for monkey-men. It is not my problem and if you can not prove me wrong, get a different religion!


